Welcome to our community

Be a part of something great, join today!

  • Hey all, just changed over the backend after 15 years I figured time to give it a bit of an update, its probably gonna be a bit weird for most of you and i am sure there is a few bugs to work out but it should kinda work the same as before... hopefully :)

Make the best out of this .R3D

I analyzed the .R3D file and in all honesty i believe it was not exposed optimally. I think you have light bouncing on your walls and ceiling and getting where it shouldn't be.

You should repeat the test covering the space between the camera and the test chart with a black cloth.

Also, by adjusting the curves accordingly i could see all the wedges from the brightest to the darkest! That was strange. Shouldn't the last wedge on the right be completely dark and indistinguishable from the background?
2349138580_50fea3f9c4_o.jpg


However, i counted 21 different wedges and if this test was done properly i think i would have counted 22 which is 11 stops and close to what RED says (11.3).

2348305445_7298e1f5cd_o.jpg


Miltos


EDIT: Added the two screenshots
 
http://www.cinematography.com/forum2004/index.php?showtopic=29800

I don't want to sound too negative, but I just want to point out that this kind of test may be affected by IR sensitivity. We know that the Red has some sensitivity to IR, and it can cause problems when using strong ND filters. My question: is that test target equally opaque in the visible and the IR? I believe the target is quite possibly less opaque in the IR at the higher densities (most dyes and pigments behave that way). This will cause you to measure more dynamic range than actually exists in visible light. Especially if you use a tungsten source, as apparently they did. Anyway, here's my plot from that R3D file. After step #17 I'd say the separate steps become hard to see in the noise, although the trend continues downwards.

EA-DNR-031808.png


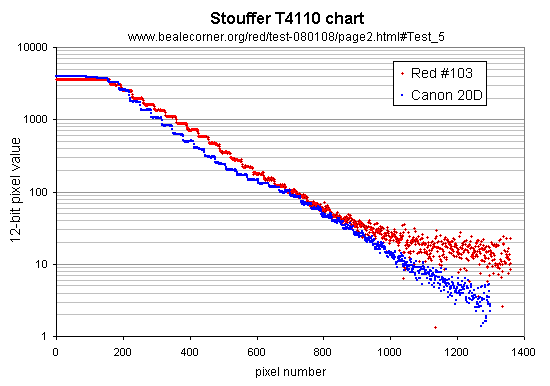
For what it's worth, I did a similar test chart shot with Red using a fluorescent backlight, to avoid the IR problem. R3Ds available for download here: http://www.bealecorner.org/red/test-080108/page2.html#Test_5

StoufferT4110-Red-20D-1.png
 
Milto, there wasn’t any light from the ceiling or the floor, the camera was facing the chart with a 50mm lens, the distance from the chart was 40cm away…

The photo of the setup in cinematography post is with very slow shutter, we didn’t see that much light with our eyes… and the aperture was something like 8 to 11… so how can a

The chart is ending between the upper and lower dots as is evident on the close up photo. The bright dots are for that reason. To be easy to find the end of the chart…

Chart_close_up.jpg

Close up photo

So what you see is just a ghost, its not exists, the debayering algorithm tries to guess… what is there… that’s why you see that…

Ghost.jpg

The ghost...

Jbeale, as for the back light, it is fluorescent… and I measured with a spectrophotometer and there’s no IR …

I liked very much the first graph… its very informative. I can count 13 steps with acceptable noise level, I thing the 14 till 17 has more than 1/3 to 2/3 of stop noise which is unacceptable. Can you compare it with the stills that I have posted on cinematography as a reference instead of Canon 20D?

In my chart I can count 17 above noise in your chart 24 above noise so I got 8,5 stops (17 x 0,5 F-stop) and you got 8 stops (24 x 1/3 F-stop) so you need to increase the backlight level…

And to the point of the original question, if this is the best, what were the settings on Redcine or Redalert in order to use them on our projects?


Milto with 21 has won until now, who can get more? What was your settings?
 
Evangelos you are right. There seems to be some kind of ghosting or horizontal lens flare. I can see it also on the left side.

Did you use any filters in front of the lens? Did you try another lens to see if it had the same effect? I am asking because it doesn't look like a debayering error.

I am 99% sure that i could get 22 wedges out of REDCINE if it was shot without this 'ghosting' as it messes up with the darker ones.

Anyway, i think the next test of this kind should be done with the incoming build 16 that contains the "monster" image improvements as Mr. Jannard said.

Miltos Pilalitos
 
So what you see is just a ghost, its not exists, the debayering algorithm tries to guess… what is there… that’s why you see that…

I don't know how the debayer works, but another possibility is that there is some stray reflection in the lens to cause the ghosting. One thing to compare is to take the same shot and then black out the brightest regions on the left of the chart, and see if you still see the "ghost" part on the right.

Jbeale, as for the back light, it is fluorescent… and I measured with a spectrophotometer and there’s no IR …

Sorry, I just assumed you'd used tungsten light, but it sounds like you are doing everything correctly.

For my graph I just took the raw data without any post-processing adjustment at all, except to shift the DC offset down a bit. If you use Redcine with the "Camera RGB" and gamma = 2.0 and no adjustments, desaturate in Photoshop, and plot the graph using ImageJ, you should get the same thing. Note, on the chart from my test, the Canon 20D data has a curve in the middle which is not "real". It turned out to be from the raw converter I used (BreezeBrowser). I tried a different one (DCRAW) later on the 20D file and there was no midpoint curve.
 
It's not the debayer that's causing that. It looks like some kind of very low level flare to me.

Graeme
 
However, i counted 21 different wedges and if this test was done properly i think i would have counted 22 which is 11 stops and close to what RED says (11.3).

Miltos

The last 5, (17-21) have too much noise in them, and I personally would not count them, and in addition the first one seems blown out. So effectively the range is about 16-17.
 
When I looked at the R3D, the first was perfectly usable if you use DRX/Highlight to fix the differential clipping in the highlight. (Highlight is not right in current Redcine build, but fixed for the next release.)

Graeme
 
The last 5, (17-21) have too much noise in them, and I personally would not count them, and in addition the first one seems blown out. So effectively the range is about 16-17.

I think in this kind of test we can count the wedges that we can tell apart from their neighbors. That means that in real life footage we could see and recognize information there. Noise or no Noise.

The first one doesn't look blown out here. Did you check the R3D file?
 
I think the point about lens flare is a very good one.. you always have to use some type of lens... unless you have a really excellent lens with regard to flare and ghosting, it's going to affect how much dynamic range you see in the final image even with the best possible sensor.
 
The lens that we used was Arri Distagon 50mm T2,1.

All the test that I have done in the same setup didn’t got a flare.

The other tests were with the HVX200 lens, D70 Nikon, Canon 5D, Canon cinestyle zoom, and broadcast canon zoom.

I don’t thing this is lens flare but when I will set up the camera again for that shot I will cover the first steps…

It was difficult to expose the first step we did three exposures with different aperture and this one appears to be the correct.

Jbeale can you please explain the exact steps with imageJ because I can’t replicate your graphs…

Graeme what settings you thing it’s the best in RedCine to get the most of it for grading purposes, in Color?
 
Jbeale can you please explain the exact steps with imageJ because I can’t replicate your graphs…

Are you using the ImageJ line tool, and then "Analyze -> plot profile" ? That should give you a plot as in the attached screenshot, using linear axes so the data falls on a curve. But I like a semi-log plot, so I copied that data into the clipboard, then into Notepad, saved as text, imported into Excel and plotted the data there using log scale on the vertical axis.

Ok, I should also confess that Redcine does not run well on my old WinXP system, that's why I wrote myself a private tool to export to TIFF (shhh, don't tell anyone). I have no demosaic so it only exports at 1/2 resolution. But apart from the resolution, on every sample I've tried, the output is a very close match to what Redcine calls "Camera RGB" colorspace with gamma = 2.0 and no further adjustments. So I didn't use the official tools but I don't think that is a significant variable. Except that I worked with a 2k output, so by averaging 4 pixels into one I assume I'm reducing the per-pixel noise relative to a 4k frame.
 
Back
Top