Welcome to our community

Be a part of something great, join today!

  • Hey all, just changed over the backend after 15 years I figured time to give it a bit of an update, its probably gonna be a bit weird for most of you and i am sure there is a few bugs to work out but it should kinda work the same as before... hopefully :)

Dynamic Range Capabilities of RED MX Digital Camera

Sanjin Jukic

Well-known member
Joined
Dec 28, 2006
Messages
8,929
Reaction score
1
Points
36
Location
Vienna, Austria
Website
www.sanjinjukic.com
Dynamic Range Capabilities of RED MX Digital Camera

By Yuri Neyman, ASC - Gamma and Density Co. and
Aaron Peak, colorist-researcher of Hollywood DI
The test performed by very experienced Red and 3cP expert DIT Brook Willard confirms...

Test were done for tungsten and daylight conditions with two ISO camera ratings – 320 and 800.

Here are results:

JOURNAL-JUNE-2010-DYN_RANGE_clip_image012.png


JOURNAL-JUNE-2010-DYN_RANGE_clip_image014.png


Results:

RED MX Useable Extractable Latitude (conservative)
800 @ F5.6: -2 thru +1.5 = 9.5 Stops
320 @ F4: -2.5 thru +1.5 = 10 Stops

RED MX Potentially Acceptable Extractable Latitude (generous)
800 @ F5.6: -2.5 thru +2.5 = 11 Stops
320 @ F4: -3 thru +2 = 11 Stops

Read more>>>
 
Interested what Alexa will produce using the same technique.

Dynamic Range Capabilities of RED MX Digital Camera

By Yuri Neyman, ASC - Gamma and Density Co. and
Aaron Peak, colorist-researcher of Hollywood DI
The test performed by very experienced Red and 3cP expert DIT Brook Willard confirms...

Test were done for tungsten and daylight conditions with two ISO camera ratings – 320 and 800.

Here are results:

JOURNAL-JUNE-2010-DYN_RANGE_clip_image012.png


JOURNAL-JUNE-2010-DYN_RANGE_clip_image014.png


Results:

RED MX Useable Extractable Latitude (conservative)
800 @ F5.6: -2 thru +1.5 = 9.5 Stops
320 @ F4: -2.5 thru +1.5 = 10 Stops

RED MX Potentially Acceptable Extractable Latitude (generous)
800 @ F5.6: -2.5 thru +2.5 = 11 Stops
320 @ F4: -3 thru +2 = 11 Stops

Read more>>>
 
DSC102.jpg
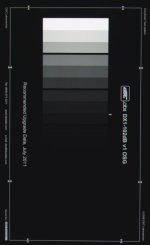
I shot this at DSC labs on M-X - it's an 18 stop backlit chart, each step is one stop, and they're grouped into threes for easy counting. The top step was exposed to "just below" clip.

Yuri's paper doesn't make sense where he says you can only ever see 5.7 stops or something. I can easily see 6 on this chart, 9 are not hard to see and depending how dark my room is I see 10 or 11, and that's without going into levels to dig into the shadows to see what's happening. I think the guys a DSC were as impressed as I was when we put the camera on the chart.

Graeme
 
I'm now thoroughly confused. What happened to the 13.5 stops that everyone was raving about recently? :confused1:
 
Well, if you dig into the shadows, you can see them to around 13.5 or so. Yuri's paper talks about what you can see "flat", without digging or selective secondary correction. He's saying something that a simple "point the camera at a chart and look at the screen" test refutes through the simple ability to count beyond 5, which I think anyone can see from the screengrab I included.

Graeme
 
I can count 10 here from your screengrab, Graeme. I have no idea where they get 5.6 from. I can't make sense of that paper at all. At least when you post I can follow what you're saying, but with some people, they invent their own terms and mix up terminology to such an extent that I just can't follow it at all.

Albert

Odd - I see 10 as well, 11 counting black.
 
Yes, and that's without digging. If you dig you can see about 13.5 or so.

Graeme
 
View attachment 7193
I shot this at DSC labs on M-X - it's an 18 stop backlit chart, each step is one stop, and they're grouped into threes for easy counting. The top step was exposed to "just below" clip.

Yuri's paper doesn't make sense where he says you can only ever see 5.7 stops or something. I can easily see 6 on this chart, 9 are not hard to see and depending how dark my room is I see 10 or 11, and that's without going into levels to dig into the shadows to see what's happening. I think the guys a DSC were as impressed as I was when we put the camera on the chart.

Graeme

I can see 10 on that in a standard lit room. More if I went into the edit suite I'm sure.
 
This is why I try to not get too hung up on numbers, everyone tests for their own working methodology, which is fine. And we all won't agree on what counts as "usable" in a color-correction session.

What's more interesting or valuable to me are relative comparisons between two different cameras, then it's more clearly visible what the practical difference will be rather than a theoretical difference.

For example, I'd get more out of a test where someone just underexposed each camera by five stops and then overexposed them by five stops and then corrected the shots back to normal -- that would tell me more about the practical limitations. And even that test would have to be taken with a grain of salt because the baseline ASA rating would affect the results, as well as export gamma, etc.

But this game of one person testing one camera with one method and coming up with "X" number of stops of DR and arguing with a person who tested a different camera using a different method and getting "Y" number of stops of DR... well, it's meaningless. Far too many variables involved to make absolute judgements about comparative differences.
 
I think the issue here is that Yuri is saying you can't see more than 5.7 stops, which I think I've demonstrated is ludicrous. His "lattitude" measurements seeing 10-11 stops before with his personal noise threshold is reasonable enough. The statement that " Observable “Flat” Dynamic Range of the most cameras is (including RED MX) is 5.7 Fstops" is the one which makes little or no sense at all.

On his Arri chart, "The range between point 2 (Darkest Visible Point) and point 3 (Brightest Visible Point) is 5.7 Fstops." I really can't follow what he's on about. The points on the chart appear to be 19R and 9L for highlight and shadow, and on the chart we have, that's 1.53EVfor highlight and 12.99EV for shadow, giving a range of 11.46, which although not what we've got, is at least reasonable. To say that Yuri's paper makes no sense is an understatement. All it does is leads to confusion in anyone who reads it.

Graeme
 
This is why I try to not get too hung up on numbers, everyone tests for their own working methodology, which is fine. And we all won't agree on what counts as "usable" in a color-correction session.

David,

Your statement made me look around a bit. I found a bunch of DPs all testing the DR of different cameras - not surprising in the least. But then I looked at the methodology and it seems like almost every DP had some different way of going about it. Here, for instance...the "white stuff taped to a board accompanied by black stuff taped to a board" test. How bizarre, at least to me.

The fact that one can pull 10 - 13.5 stops out with little damage to the image in post is enough for me. :beer:
 
For measuring DR I think this test is flawed for one major reason: The amount of latitude in the "texture sceen" and the chip chart are not factored into the results! I do not see one single point of the frame that is pushed over the top AND the same point falling to black/noise. I see the white side blowing out and loosing detail and I see the dark side falling to black/noise: BUT what is the difference between the white ban black sides in stops????

This test IS VERY USEFUL to know how much you can over and underexpose a 6 stop sceen!

What I want to know as a real working Cinematographer is how high can my highlights go and how deep can I let the shadows go? I am less concerned if I grossly miss my proper exposure by 4 or 5 stops. It is good to know how dark you can shoot at night under natural light, if you need to.

Prost,
Rich
 
Here is the way I see it. The same point over and underexposed to establish DR.


So, I can confidently say I am getting 13.5 stops out of my Red MX camera.

I posted this in mid February. I did this test for my own knowledge before taking the camera out on a commercial shoot. I wondered about my results because I changed the stops with the lens iris and camera shutter.


Then Jim posted his early Arri DR test that seemed to agree. (There is some concern about calibration.)


This week I re-shot my test and instead of using the lens to accomplish my stop differences I used light (and shutter). To be specific I used 3 light meters to measure it in footcandles. My findings were again 13.5 stops. Here is the specific area of the chart I am looking at to determine if the camera can see a delineation between the two shades.
TestBox.png


I did TIFF still frames of the exposures. The Red MX was at 500iso (really just metadata) Here is +4 stops:
4crop.png

Here is -9 stops and -9.5 (the bar to the right is ½ stop darker.)
-9--95.png


I stand behind my 13.5 stops! BUT, here is the real zinger. When I look at -10 stops under I cannot see the difference of the shades. However, when I play the -10 stops at speed with my MacPro and RedRocket card I can then see the delineation of the two shades. Granted it is noisy and I am pulling up the image hard with RedCineX but I can make out the line. Here is -10. You decide, you do the math:


-10crop.png


Sorry, its so noisy. Its better when I roll the footage.

Like I said, I definitely stand behind my 13.5.

I am not enough of a post guru to argue 12 bits = 12 stops…. I am a shooter of 22 years and I know lighting and cameras and I know what I am seeing. The Red MX is seeing a delineation at these levels. Perhaps Graeme can contribute here to the bits=stops theory.

To the doubters, I say, test it yourself and lets look at your findings.

To the other camera manufacturers, I say, Give me your cameras to test and I will wring them out just the same.

All the Best,
Rich
 
Last edited:
HD images from methodologically controversial test of “Dynamic Range Capabilities of RED MX Digital Camera" from Gamma and Density


LINK>>>
 
I could make out 12 (11 shades + black) stops from Graeme's screengrab, and that's in a fairly well lit room with an uncorrected computer screen so :001_wub:
 
So, on the backlit chart from DSC we can use our tools to measure the light coming from each step. We did that at DSC labs with their spectrophotometer and I did the same with my spectroradiometer, so we know the chart is good. It's actually very hard to measure from stop 15 onwards as it's just so dark! It takes a lot of effort to put such an extreme dynamic range into a single chart.

Graeme
 
I like to know theoretical limits and expect a manufacturer to give me scientific lab results. I personally use a methodology like David's with both charts and scenes on location. Each has it's own value and both need to be considered together. Well rounded conclusions can only be drawn from multiple, reliable data sources.

Remember when you were in school and you turned in a research paper with only one or two resources? You either got the paper back with instructions to quote more sources, or you got a D or F. Some folks didn't learn the lesson that exercise was meant to teach. I would naturally question their conclusions.
 
Back
Top